



How to Find Yield Strength From Test Data and a Stress-Strain Curve


You can find yield strength from a tensile test by converting the load at yield into engineering stress using the specimen's original cross-sectional area:
Yield strength:
where Fy is the load at yield and A0 is the specimen's original cross-sectional area. If the test produces a stress-strain curve without a clearly defined yield point, the 0.2% offset method is commonly used to determine the yield strength.
The calculation itself is straightforward. The harder part is identifying the correct yield point, using the right specimen dimensions, and knowing whether the reported value applies to the material condition and test method you are working with.
The sections below focus on the practical path from tensile-test data to a usable yield-strength value.
What Is Yield Strength?
Yield strength is the stress at which a material begins to undergo permanent plastic deformation under a specified test criterion. Below this point, deformation is generally elastic and the specimen can largely recover its original shape after unloading. Beyond it, some deformation remains after the load is removed.
For engineering work, yield strength is often reported as yield stress. The two terms are generally used interchangeably when they refer to the same test criterion. A yield load, however, is a force, while yield strength is a stress calculated from that force and the original specimen area.
Yield Strength and the Elastic-Plastic Transition
The important distinction is whether the deformation can be recovered after unloading. In the initial elastic region, stress and strain are approximately proportional, and the slope of the stress-strain curve represents Young's modulus. Once permanent plastic deformation begins, the material no longer returns completely to its original dimensions.
Some metals show a distinct upper and lower yield point. Others transition gradually from elastic to plastic behavior. For the latter, a specified proof or offset method provides a reproducible way to report yield strength.
| Term | What it represents |
|---|---|
| Yield strength / yield stress | Stress associated with the specified onset of permanent deformation |
| Yield point | A visible yielding point or region on the stress-strain curve |
| Yield load | Force corresponding to the selected yield criterion |
| Yield strain | Strain associated with yielding |
| Ultimate tensile strength (UTS) | Maximum engineering stress reached during the tensile test |
What Is the Yield Strength Formula?
The basic yield strength formula is:
Here, σy is yield strength, Fy is the load at yield, and A0 is the specimen's original cross-sectional area. The formula uses engineering stress, so the area is the original area measured before the tensile test.
For a round tensile specimen:
where d0 is the original diameter.
For a flat specimen:
where w0 is the original width and t0 is the original thickness.
Units Matter
If force is recorded in newtons and area in square millimeters:
1 N/mm2 = 1 MPa
For inch-pound calculations, force and area must remain consistent so the resulting stress is reported correctly in psi or ksi.
Do not mix a force value in newtons with an area in square inches without converting one of them first.
A Simple Yield-Strength Calculation
Suppose a round specimen has:
- Original diameter: 12.7 mm
- Yield load: 31,750 N
The original area is:
The yield strength is therefore:
So the calculated yield strength is approximately 251 MPa.
This is a simplified uniaxial tensile calculation. A real component with holes, threads, notches, bending, eccentric loading, fatigue, or other stress concentrations requires a separate structural assessment.
Which Method Should You Use?
The method depends on what your test data actually contains. A known yield load can be converted directly into stress, while a stress-strain curve requires you to identify the yield point or apply an offset criterion.
| What you have | Method to use |
|---|---|
| Yield load and original specimen area | Calculate σy = Fy / A0 |
| Stress-strain curve with a clear yield point | Read the yield stress from the curve |
| Stress-strain curve without a clear yield point | Use the applicable offset method, commonly 0.2% |
| Force and extension data from a test machine | Convert to engineering stress and strain, then determine the yield criterion |
| Excel/CSV tensile-test data | Build the stress-strain curve and calculate the offset intersection |
How Do You Find Yield Strength From a Tensile Test?
A tensile test provides the force and deformation data needed to calculate engineering stress and strain and identify yielding. For metallic materials, ASTM E8/E8M covers tension testing and specifically includes determination of yield strength, yield point elongation, tensile strength, elongation, and reduction of area. The current active edition is ASTM E8/E8M-25.
ISO 6892-1:2019 specifies tensile testing of metallic materials at room temperature and defines the mechanical properties that can be determined from the test. ISO states that this edition was reviewed and confirmed in 2025 and remains current.
The exact test procedure still depends on the material specification and customer requirements. A standardized tensile specimen does not automatically reproduce the behavior of the finished component.
What Test Data Do You Need?
To calculate or identify yield strength from raw tensile-test data, you normally need:
- Original specimen diameter, or original width and thickness
- Original gauge length
- Force or load data
- Extension or strain data
- Applicable test standard
- Yield criterion or offset value, where applicable
- Material grade and condition
The original gauge length is used to calculate engineering strain:
Engineering stress is calculated from:
This converts the machine output into the stress-strain curve used to determine yield behavior.
Reading Yield Strength From a Stress-Strain Curve
A stress-strain curve shows how the material responds as tensile load increases. To find yield strength, first identify whether the curve has a distinct yield point. If it does, the corresponding engineering stress can be used according to the applicable test method. If the transition is gradual, an offset criterion such as 0.2% is used.
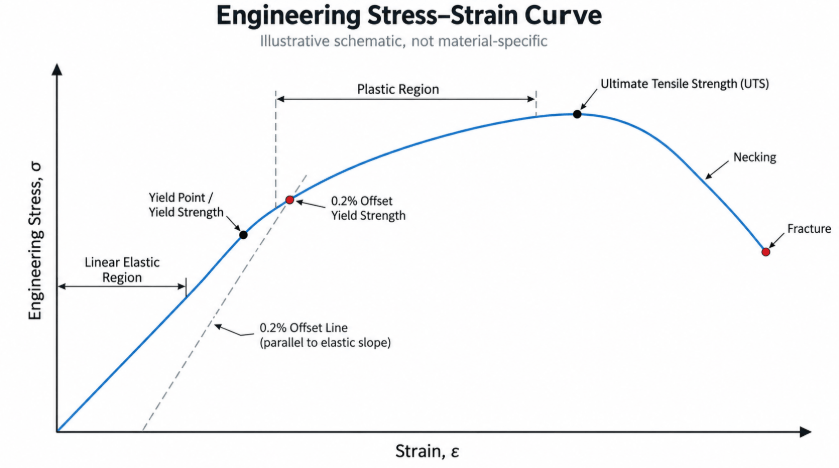
Figure 1 — Engineering stress-strain curve
The main regions are:
- Elastic region: deformation is substantially recoverable.
- Yield region: permanent deformation begins according to the selected criterion.
- Plastic region: additional loading produces permanent deformation.
- Ultimate tensile strength: the maximum engineering stress on the curve.
- Necking and fracture: localized deformation develops before the specimen breaks.
A clear yield point is common for some materials and material conditions, but it is not visible on every stress-strain curve. That is where the 0.2% offset method becomes useful.
How Does the 0.2% Offset Method Work?
The 0.2% offset method defines yield strength by drawing a line parallel to the initial elastic portion of the stress-strain curve and shifting it by 0.002 strain. The stress where this offset line intersects the measured curve is the 0.2% offset yield strength.
The procedure is:
- 1. Identify the initial linear elastic portion of the stress-strain curve and determine its slope.
- 2. Mark an engineering strain of 0.002, equivalent to 0.2%.
- 3. Draw a line parallel to the elastic slope through that offset strain.
- 4. Read the stress at the intersection between the offset line and the stress-strain curve.
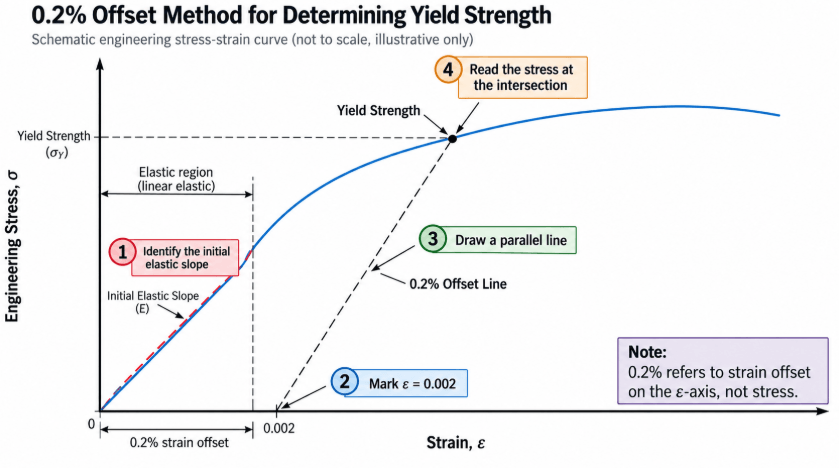
Figure 2 — How the 0.2% offset method determines yield strength
The 0.2% value is a strain offset, not the yield stress. The reported result should also identify the criterion used, such as “yield strength at 0.2% offset,” rather than presenting the number without context.
How Do You Calculate Yield Strength From Raw Test Data?
Raw tensile-test data usually needs to be checked and converted before the yield strength can be identified. A machine may record force against crosshead displacement, while the calculation requires engineering stress and strain based on the specimen geometry and gauge length.
Before calculating, check:
- Units for force, dimensions, and displacement
- Original specimen dimensions
- Gauge length
- Whether the displacement channel represents gauge extension or crosshead movement
- Test speed and applicable standard
- Material grade and condition
- Whether the data contains obvious machine or fixture artifacts
Crosshead displacement can include deformation from the machine, fixtures, grips, and specimen seating. It is therefore not automatically equivalent to gauge extension.
Handling Noisy Test Data
Real test data rarely looks as clean as a textbook curve. Small fluctuations can come from measurement resolution, grip movement, machine compliance, alignment, or other test-system effects.
A smoothing operation may make the curve easier to inspect, but it should not change the underlying yield criterion. A visually smoother curve is not necessarily a more accurate curve.
If filtering or smoothing is used, keep the original data and document the method. For qualification, acceptance testing, or safety-critical work, follow the applicable testing standard and material specification rather than selecting a yield point simply because it looks convenient on a graph.
How to Find 0.2% Offset Yield Strength in Excel
Excel can handle a basic 0.2% offset calculation when tensile-test data are available as force and extension or stress and strain columns. The important part is converting the raw data correctly before looking for the intersection.
A practical workflow is:
- 1. Import the force and extension data from the test machine.
- 2. Calculate engineering stress using (F / A0) and engineering strain using (ΔL / L0).
- 3. Plot stress against strain and identify the initial elastic region.
- 4. Determine the elastic slope (E) from that region.
- 5. Create the offset line using:
σ = E(ε − 0.002)
- 6. Add the offset line to the stress-strain chart and locate its intersection with the measured curve.
- 7. Read the corresponding stress as the 0.2% offset yield strength.
For noisy data, the intersection may not fall exactly on one recorded data point. Linear interpolation between nearby points can provide a more useful estimate than simply selecting the closest row.
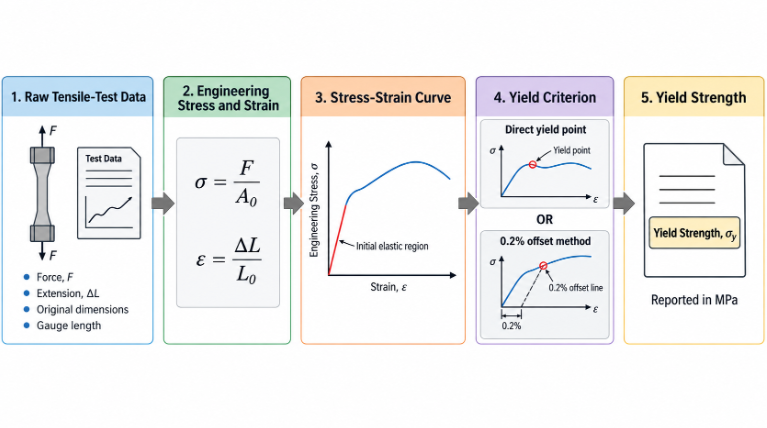
Figure 3 — From raw tensile-test data to yield strength
If the test machine already exports engineering stress and strain, the first conversion steps may not be necessary. Always check how the machine software defines its stress and strain channels before duplicating the calculation.
Yield Strength vs. Ultimate Tensile Strength
Yield strength and ultimate tensile strength describe different points on a tensile test. Yield strength marks the selected onset of permanent deformation, while UTS is the maximum engineering stress reached during the test. For many ductile materials, UTS is higher than yield strength.
| Property | Yield Strength | Ultimate Tensile Strength |
|---|---|---|
| Meaning | Onset of specified permanent deformation | Maximum engineering stress |
| Location on curve | Before or around the start of plastic deformation | Peak of engineering stress curve |
| Design concern | Permanent deformation | Maximum tensile capacity before fracture progression |
| Typical use | Allowable stress and yielding checks | Strength comparison and failure assessment |
For many mechanical components, yielding matters long before fracture. A bracket that permanently bends under load may already have failed its functional requirement even though its material is still far from its ultimate tensile strength.
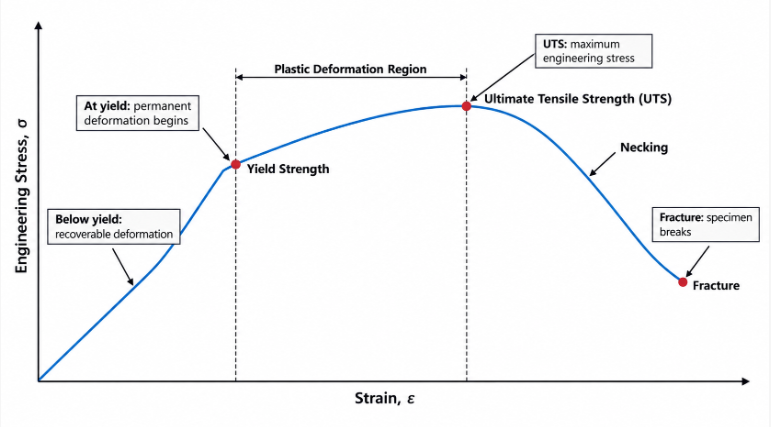
Figure 4 — Yield strength vs. tensile strength
Why Can a Finished Part Have a Different Yield Strength From a Datasheet?
A material datasheet value describes a defined material condition and test configuration. It should not automatically be treated as the exact mechanical behavior of a finished part. ASTM E8/E8M-25 explicitly notes that tensile results from standardized specimens taken from selected portions of a material may not fully represent the strength and ductility of the entire end product or its in-service behavior.
Several manufacturing factors can change the result:
| Manufacturing process | Factors that can affect yield behavior |
|---|---|
| CNC machining | Material grade, heat-treatment condition, residual stress, machining direction, and surface condition |
| Sheet metal forming | Work hardening, forming direction, bend location, and prior deformation |
| Injection molding | Resin grade, fiber orientation, gate location, packing, cooling, and moisture condition |
| Casting | Porosity, microstructure, heat treatment, wall thickness, and solidification conditions |
| Additive manufacturing | Build orientation, layer bonding, porosity, process parameters, and post-processing |
Material condition also matters. Heat treatment, aging, annealing, and cold work can change the mechanical properties of the same nominal alloy. For steel, the reported yield strength can vary substantially with grade, temper, heat treatment, and product form, so “yield strength of steel” is not a single material value.
The same issue appears when comparing a standard tensile coupon with a real part. A thin wall, hole, notch, weld, molded feature, or printed layer interface may create a local condition that is not represented by the nominal material value.
How Should You Use Yield Strength in Part Design?
Yield strength is useful for checking whether a component may undergo permanent deformation, but it is only one input to a complete design assessment. A simple allowable-stress relationship is:
where n is the selected safety factor.
The appropriate value of n depends on the application, material uncertainty, loading, failure consequences, applicable standards, and validation requirements. It should not be selected from a generic table without considering the actual design conditions.
Yield Strength Is Not the Only Failure Check
A component can have a nominal average stress below yield strength and still fail functionally because of:
- Stress concentration around holes, threads, or sharp transitions
- Buckling in slender structures
- Fatigue under repeated loading
- Shear or combined loading
- Temperature or environmental exposure
- Creep in some materials
- Joint or fastener failure
- Material anisotropy
For example, a part with a nominal tensile stress below the material's yield strength may still experience local yielding around a sharp notch. Likewise, a polymer or composite part may require a different set of mechanical criteria because its behavior depends strongly on temperature, strain rate, time, orientation, or other conditions.
For FEA, the material input should also match the analysis. A single yield-strength value may be insufficient for nonlinear plastic analysis, where the relevant stress-strain behavior beyond first yield is required. This is also where design-for-manufacturing review can help connect material properties with part geometry, loading, and production requirements.
Common Errors When Finding Yield Strength
Most calculation errors come from using the wrong load, geometry, or yield criterion rather than from the formula itself.
Using the maximum load as yield load: the maximum load normally corresponds to UTS, not yield strength.
Using the reduced cross-section after deformation: the basic engineering-stress calculation uses the specimen's original area (A0).
Treating 0.2% as a stress value: 0.2% is the strain offset used to construct the proof line.
Ignoring material condition: alloy designation alone may not define the required mechanical property. Temper, heat treatment, aging, and cold work can matter.
Reporting a number without the test method: a yield-strength value is much more useful when the test standard and offset criterion are known.
Replacing qualification data with a generic material webpage: typical values are useful for early design decisions, but critical parts should be based on the applicable material standard, certification, test report, and engineering validation.
How Do You Choose the Right Yield Strength Value?
The right yield-strength value is the one that matches the material, condition, test method, loading direction, and design situation you are evaluating.
Before using a value in a drawing, simulation, or procurement specification, check:
| Check | What to confirm |
|---|---|
| Material | Exact alloy or polymer grade |
| Condition | Temper, heat treatment, aging, annealing, or other processing |
| Test method | Applicable ASTM, ISO, or material-specific standard |
| Yield criterion | Direct yield point, 0.2% offset, or another specified criterion |
| Direction | Whether the material is isotropic or direction-dependent |
| Temperature | Test and service temperature |
| Loading | Tension, compression, shear, cyclic, or combined loading |
| Part condition | Whether manufacturing has changed the material behavior |
This is especially important when moving from a prototype to production. A prototype material or process can demonstrate fit, form, assembly, or function without proving that the production material and process will have identical mechanical properties.
Conclusion
To find yield strength, start with the tensile-test data and identify the appropriate yield criterion. If the yield load (Fy) is known, calculate:
If the material does not show a clear yield point, use the applicable offset method, commonly the 0.2% offset method, to locate the yield stress on the stress-strain curve.
The calculation is only part of the engineering decision. Material condition, manufacturing process, specimen orientation, test standard, geometry, and service loading can all affect whether a reported yield-strength value is appropriate for the finished part.
Need Help Evaluating Material or Test Data?
If you are working from a material datasheet, tensile-test report, or CAD design and are unsure which yield-strength value should drive the design, the useful starting information is usually the material grade, condition, critical dimensions, loading requirements, and available test data.
Mastars' manufacturing engineering workflow includes DFM review, material and process evaluation, and dimensional inspection. For production parts where material and dimensional requirements need to be verified, inspection documentation such as material certificates and FAI/CMM information can be part of the manufacturing process.
Get a Quote and include any critical material requirements, dimensions, loading conditions, or test data that could affect the build.
Frequently Asked Questions
What is the formula for yield strength?
The basic engineering formula is:
Use the load corresponding to the selected yield criterion and the specimen's original cross-sectional area. If you are using a 0.2% offset result, report the criterion with the value.
How do you find yield strength from a stress-strain curve?
Find the point where the material begins permanent deformation according to the applicable test criterion. If there is no clear yield point, draw a line parallel to the initial elastic slope at a strain offset of 0.002. The intersection with the stress-strain curve gives the 0.2% offset yield strength.
Can you calculate yield strength from raw Excel or CSV test data?
Yes. You need the original specimen dimensions, gauge length, force data, and extension or strain data. Convert force to engineering stress and extension to engineering strain, plot the curve, determine the elastic slope, and apply the required yield criterion. The raw machine output should be checked first to make sure crosshead displacement has not been mistaken for gauge extension.
Is yield strength the same as yield stress?
In most engineering contexts, yes. Both terms can refer to the stress associated with the onset of specified permanent deformation. The reported value should still identify the applicable test method or offset criterion when relevant.
Why can yield strength differ between a material datasheet and a finished part?
Because the datasheet value applies to a defined material condition and test specimen. Heat treatment, forming, machining, molding, casting, additive-manufacturing orientation, residual stress, porosity, geometry, and service conditions can all affect the behavior of a finished part.
Hot Articles
Hot Tags
Stay Connected!


Manufacturing on Demand
Please fill in the following information to obtain plan details (information is confidential and not disclosed publicly), we will contact you within 24 hours, please keep your phone available!
Upload a 3D/2D model to see instant pricing, lead time, and DFM feedback.